
Grapefruit

Analytics & Optimization

Analytics dashboards and data visualisation for decision makers

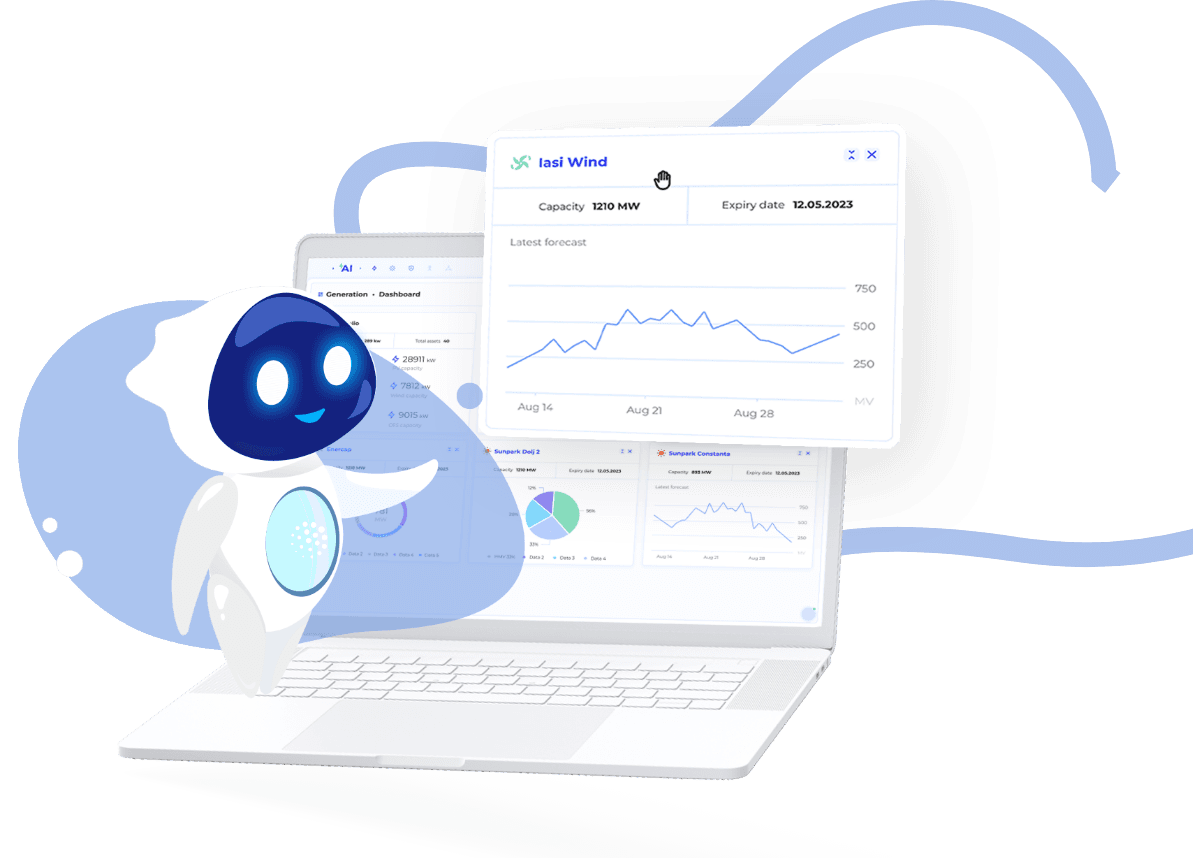
Grapefruit builds analytics dashboards that bring your most important metrics from web analytics, CRM, ad platforms, e-commerce and operational systems into one live, easy-to-read view. We start from the decisions each team makes, design dashboards for marketers, sales and executives, and connect them to trusted data sources, as in the forecasting dashboards we built for Ogre.ai.

Clients for this service: Work for Ogre.ai

Signs you need this

  • Reports are assembled by hand from several tools every month.
  • Leadership sees last month's numbers when decisions are needed today.
  • Teams track different definitions of the same metric.
  • Operational data (production, prices, stock) sits unused for decisions.

What we deliver

  • Metrics framework

    KPIs, definitions and owners agreed across teams.

  • Data integration

    Connections to analytics, CRM, ads, e-commerce and operational sources.

  • Dashboard design

    Layouts designed for scanning and action, per audience.

  • Build and automation

    Live dashboards in Looker Studio, Power BI or a custom web app.

  • Training and support

    Handover, documentation and evolution as needs change.

How we work

  1. Define decisions

    1 week

    Interviews to find the decisions and KPIs each audience needs.

    You get: Metrics framework

  2. Connect data

    1-3 weeks

    Source audit, connectors and data quality checks.

    You get: Data model

  3. Design and build

    1-3 weeks

    Prototype, feedback, build and automation.

    You get: Live dashboards

  4. Adopt

    1 week, then ongoing

    Training, documentation and iteration after first use.

    You get: Documentation · Iteration backlog

AI in this service

How AI changes analytics & dashboards at Grapefruit

Dashboards are becoming conversational: instead of hunting through charts, managers ask a question in natural language and get an answer with the source data. We add AI summaries, anomaly alerts and forecasting where your data supports them, building on the data-heavy dashboards we designed and built for Ogre.ai's AI energy forecasting platform.

Proof

Analytics & Dashboards work for our clients

Our focus is to become the first fully integrated energy management platform, providing deep insights to utilities for running their businesses more efficiently in the new digital era and for a more sustainable future.
Matei Stratan, CEO, Ogre.ai · Read the case study

Industries we deliver analytics & dashboards for

Ways to start

Fixed scopeHalf a day to 2 days, summary within 1 week

Discovery Workshop

Align business, IT and legal on what to build first, in one focused session.

  • Pre-workshop survey
  • Facilitated sessions with your decision makers
  • Prioritised initiative canvas with an owner per initiative
  • Written summary with the recommended next step

Book a discovery workshop
Fixed scope2 weeks

AI Opportunity Scan

Find the 3 AI use cases worth funding in your business, with the numbers to defend them.

  • Stakeholder interviews (5 to 8 people) and a process map
  • AI opportunity backlog ranked by value, effort and risk
  • Data readiness check for the top use cases
  • EU AI Act risk classification per use case
Book an AI Opportunity Scan

Analytics & Dashboards: frequently asked questions

Cannot find your question? Ask a senior specialist directly.

Why build custom dashboards instead of using standard reports?

Standard reports show what each tool can measure, not what your team needs to decide. Custom dashboards combine sources, use your definitions and show only the metrics that matter for each audience, so people act on them instead of exporting data to spreadsheets.

Which data sources can you connect?

Web analytics such as GA4, CRM systems such as HubSpot, advertising platforms, e-commerce platforms, databases, spreadsheets and operational systems through APIs. Data quality is checked during setup, because a dashboard is only as trustworthy as its sources.

Which tools do you build dashboards in?

Looker Studio for marketing and web analytics, business intelligence tools such as Power BI when your organisation already uses them, and custom web dashboards when data must be embedded in a product or shown to customers, as in the Ogre.ai platform.

Do dashboards update in real time?

They update as often as the sources allow: live for connected systems, hourly or daily for sources that export in batches. We document refresh times on the dashboard so nobody makes decisions on data they believe is newer than it is.

Can dashboards be tailored for different teams?

Yes. Typically an executive view with a few headline KPIs, and detailed views for marketing, sales or operations with filters and drill-downs. Access permissions follow your roles and data protection rules.

Portrait of Elizabeta Vîrlan
Elizabeta Vîrlan

Content Marketer · talk to us about analytics & dashboards

Book a 30-min call

Ready to talk about analytics & dashboards?

Tell us what you need and by when. A senior specialist replies with a clear next step, not a sales deck.

We reply within 1 business day, usually the same day. Not ready to talk? Take the free AI assessment.